
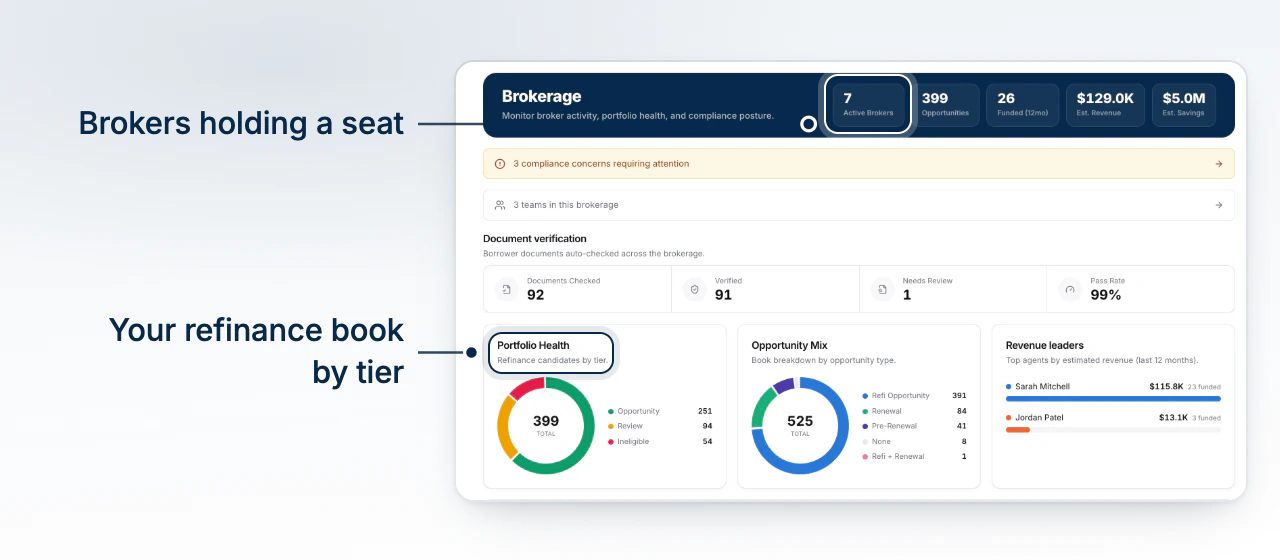
Brokerage opens on one page: the whole firm's book, at a glance, rebuilt every time you load it. Nothing here is a click into one broker's file; it is the view built to tell you where to look next.
Who Can Open the Brokerage Pages
Only an Owner or Admin, and only inside an organization actually set up as a brokerage. A solo broker is technically the admin of their own one-person org, but the page checks both facts, not just your role. Fail either one and BrokerPlus sends you back to your opportunities rather than a locked page - there is nothing here for a single-broker shop. Some brokerages are rolled onto this section a few pages at a time; a link below that leads nowhere simply hasn't been switched on for your firm yet.
The Numbers Across the Top
Five figures run across the header: active brokers holding a seat, live opportunities tiered as worth pursuing, deals funded in the trailing twelve months, the estimated revenue behind them, and total estimated savings across your refinance and renewal book. Underneath, if your access reaches every team, a line names how many broker teams the brokerage runs and links through to the roster; a narrower read, such as a compliance reviewer's, shows no such line, since team count isn't a fact their access answers.
Document Verification
A row of four figures - documents checked, verified, sent back for a person to review, and the resulting pass rate - appears only once your brokerage has actually run borrower documents through verification. Before the first document is checked, this block stays off the page rather than opening with a row of zeroes.
Portfolio Health, Opportunity Mix and Revenue Leaders
Three cards read your book from three angles. Portfolio Health is a donut of every refinance candidate by tier: an opportunity, needing review, ineligible, or not yet classified. Opportunity Mix breaks the same book down by opportunity type - a rate opportunity, a renewal, a pre-renewal, or both at once. Revenue Leaders ranks your top six agents by estimated revenue on what they have funded. Any of the three shows a plain sentence in place of a chart until there is something to show: no candidates imported, no opportunities yet, or no funded deals yet.
The Broker Performance Table
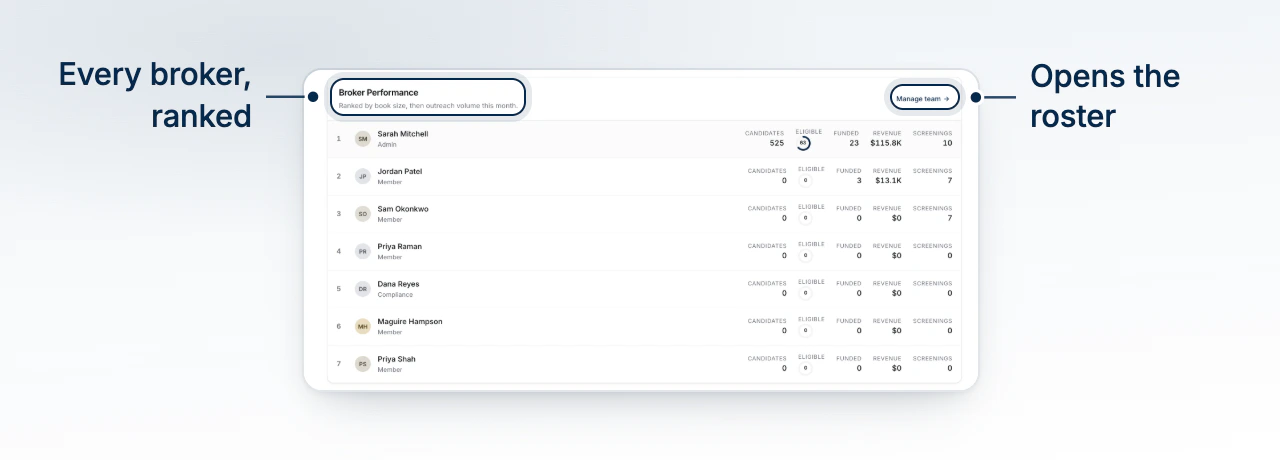
Every active broker, ranked first by how large their book is and then by their estimated revenue. Each row carries their candidate count, the share of that book rated eligible, deals funded, estimated revenue and screenings run, and opens their own scorecard when selected.
Banners That Want Your Attention
Two banners can appear above the charts, each naming a different kind of unfinished work. A gold banner counts confirmed compliance screenings still waiting on attention and links through to the Compliance page. A second banner stays up until your compliance program's setup is finished, and reads differently depending on whether that setup is in progress or hasn't started at all.
What to Do Next
- Read Read a Broker's Scorecard to open one broker's row and see the file behind it.
- Read Manage Brokers in Your Brokerage to act on what the performance table shows you.
- Read Read Brokerage Revenue for the fuller picture behind the estimated revenue figure at the top.
- Read Review Compliance Across the Brokerage for what stands behind the compliance banner.