
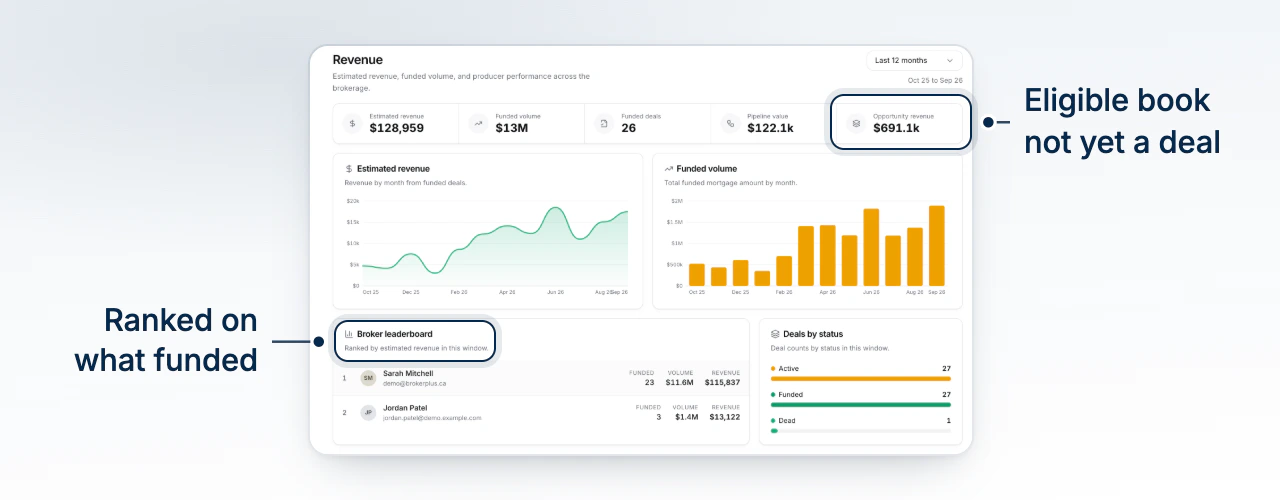
Brokerage > Revenue is the firm-wide read on what every team is producing: five totals, a broker leaderboard, and the origination funnel behind them. The figures are an internal estimate throughout, never a borrower-facing or regulated number.
Choosing the Time Window
A preset covers the last 3, 6, 12 or 24 months, or switch to Custom range and set exact start and end dates. Whichever you pick lives in the page's URL, so a reload keeps it and a pasted link opens on the same window. Switching to custom seeds the two dates with whatever trailing window you were already looking at, so the numbers don't jump before you change one.
What the Five Totals Count
Estimated Revenue is gross commission, net of any clawback, summed across every deal that funded inside the window. Funded Volume is the total funded mortgage amount behind those same deals, and Funded Deals is the count. Pipeline Value and Opportunity Revenue are not window-bound - they are a snapshot of right now: Pipeline Value estimates every deal still open today by its loan amount and finder fee, and Opportunity Revenue estimates the book's currently-eligible refinance and renewal candidates that haven't converted into a real deal yet. A book contact who already has an active deal counts once, in Pipeline Value, so nothing is estimated twice.
The Broker Leaderboard
Every broker with a funded deal in the window is ranked by estimated revenue, with their funded count and funded volume beside it. Selecting a row opens that broker's own page. Read a Broker's Scorecard covers what's on it. Next to the leaderboard, a status breakdown counts every deal in the window by where it currently sits.
The Pipeline Funnel and Time in Stage
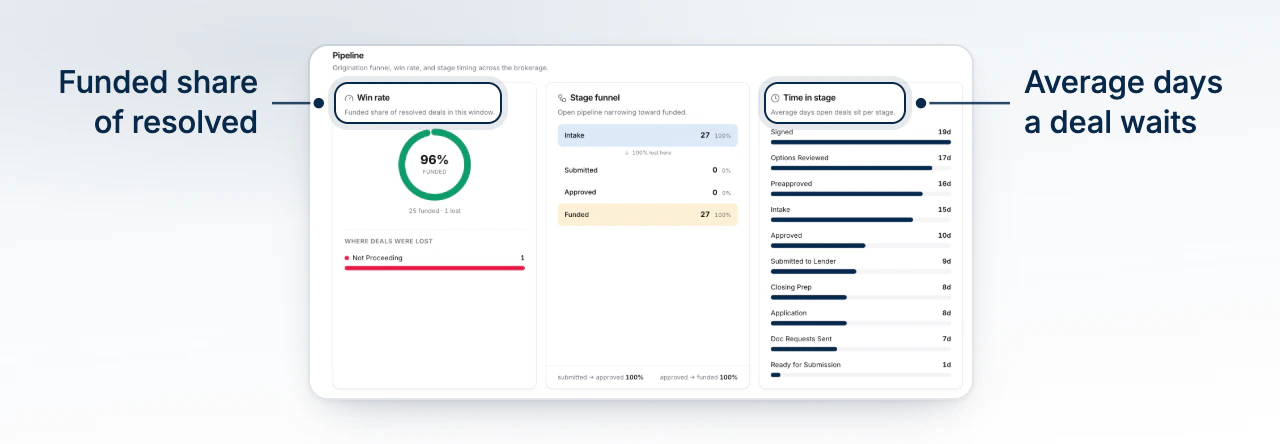
The Pipeline section below is the funnel behind the totals. A win-rate ring shows funded against lost among everything resolved in the window (lost covers declined, cancelled, expired, withdrawn, dead and closed), with a breakdown of which stage the lost deals dropped at. A stage funnel narrows the open pipeline toward funded, with the submitted-to-approved and approved-to-funded conversion rates alongside it, and a third chart shows the average days a deal sits in each stage.
Why a Deal May Be Missing
An archived deal never enters any figure on this page. A raw book candidate - a refinance or renewal opportunity nobody has actually worked yet - doesn't join the origination funnel until it converts into a real deal; until then it belongs to the refinance dashboard, not here. Estimated Revenue needs a funded date and a commission record, so a funded deal with neither still won't show. Pipeline Value needs a loan amount on the file. And the leaderboard needs an assigned broker - an unassigned deal's revenue still reaches the brokerage totals, but it has no row to land on.
What to Do Next
- Read a Broker's Scorecard to see one broker's own numbers behind their leaderboard row.
- The Brokerage Overview Page for where these totals summarize alongside the rest of the brokerage.
- Read Your Business Performance for a broker's own view of the same kind of numbers.
- Set Your Default Commission to change the finder fee these estimates are built from.